What if you could see how a neighborhood evolved during COVID-19? Track which businesses survived, which closed, and what replaced them? With temporal location intelligence, you can analyze any place not just as it exists today, but as it has changed over time - turning location data into a powerful time machine for understanding urban evolution.
Beyond Static Maps: The Fourth Dimension of Location
Traditional location APIs show you what's there now. But cities are living organisms - businesses open and close, neighborhoods transform, infrastructure evolves. Understanding how places change is as important as knowing what's there today:
- Urban Planning: "How did this neighborhood change after the new transit line opened?"
- Real Estate Investment: "Which areas are gentrifying fastest?"
- Retail Strategy: "What types of businesses survived the pandemic here?"
- Economic Research: "How did downtown cores evolve post-remote work?"
- Social Impact: "Are local businesses being displaced by chains?"
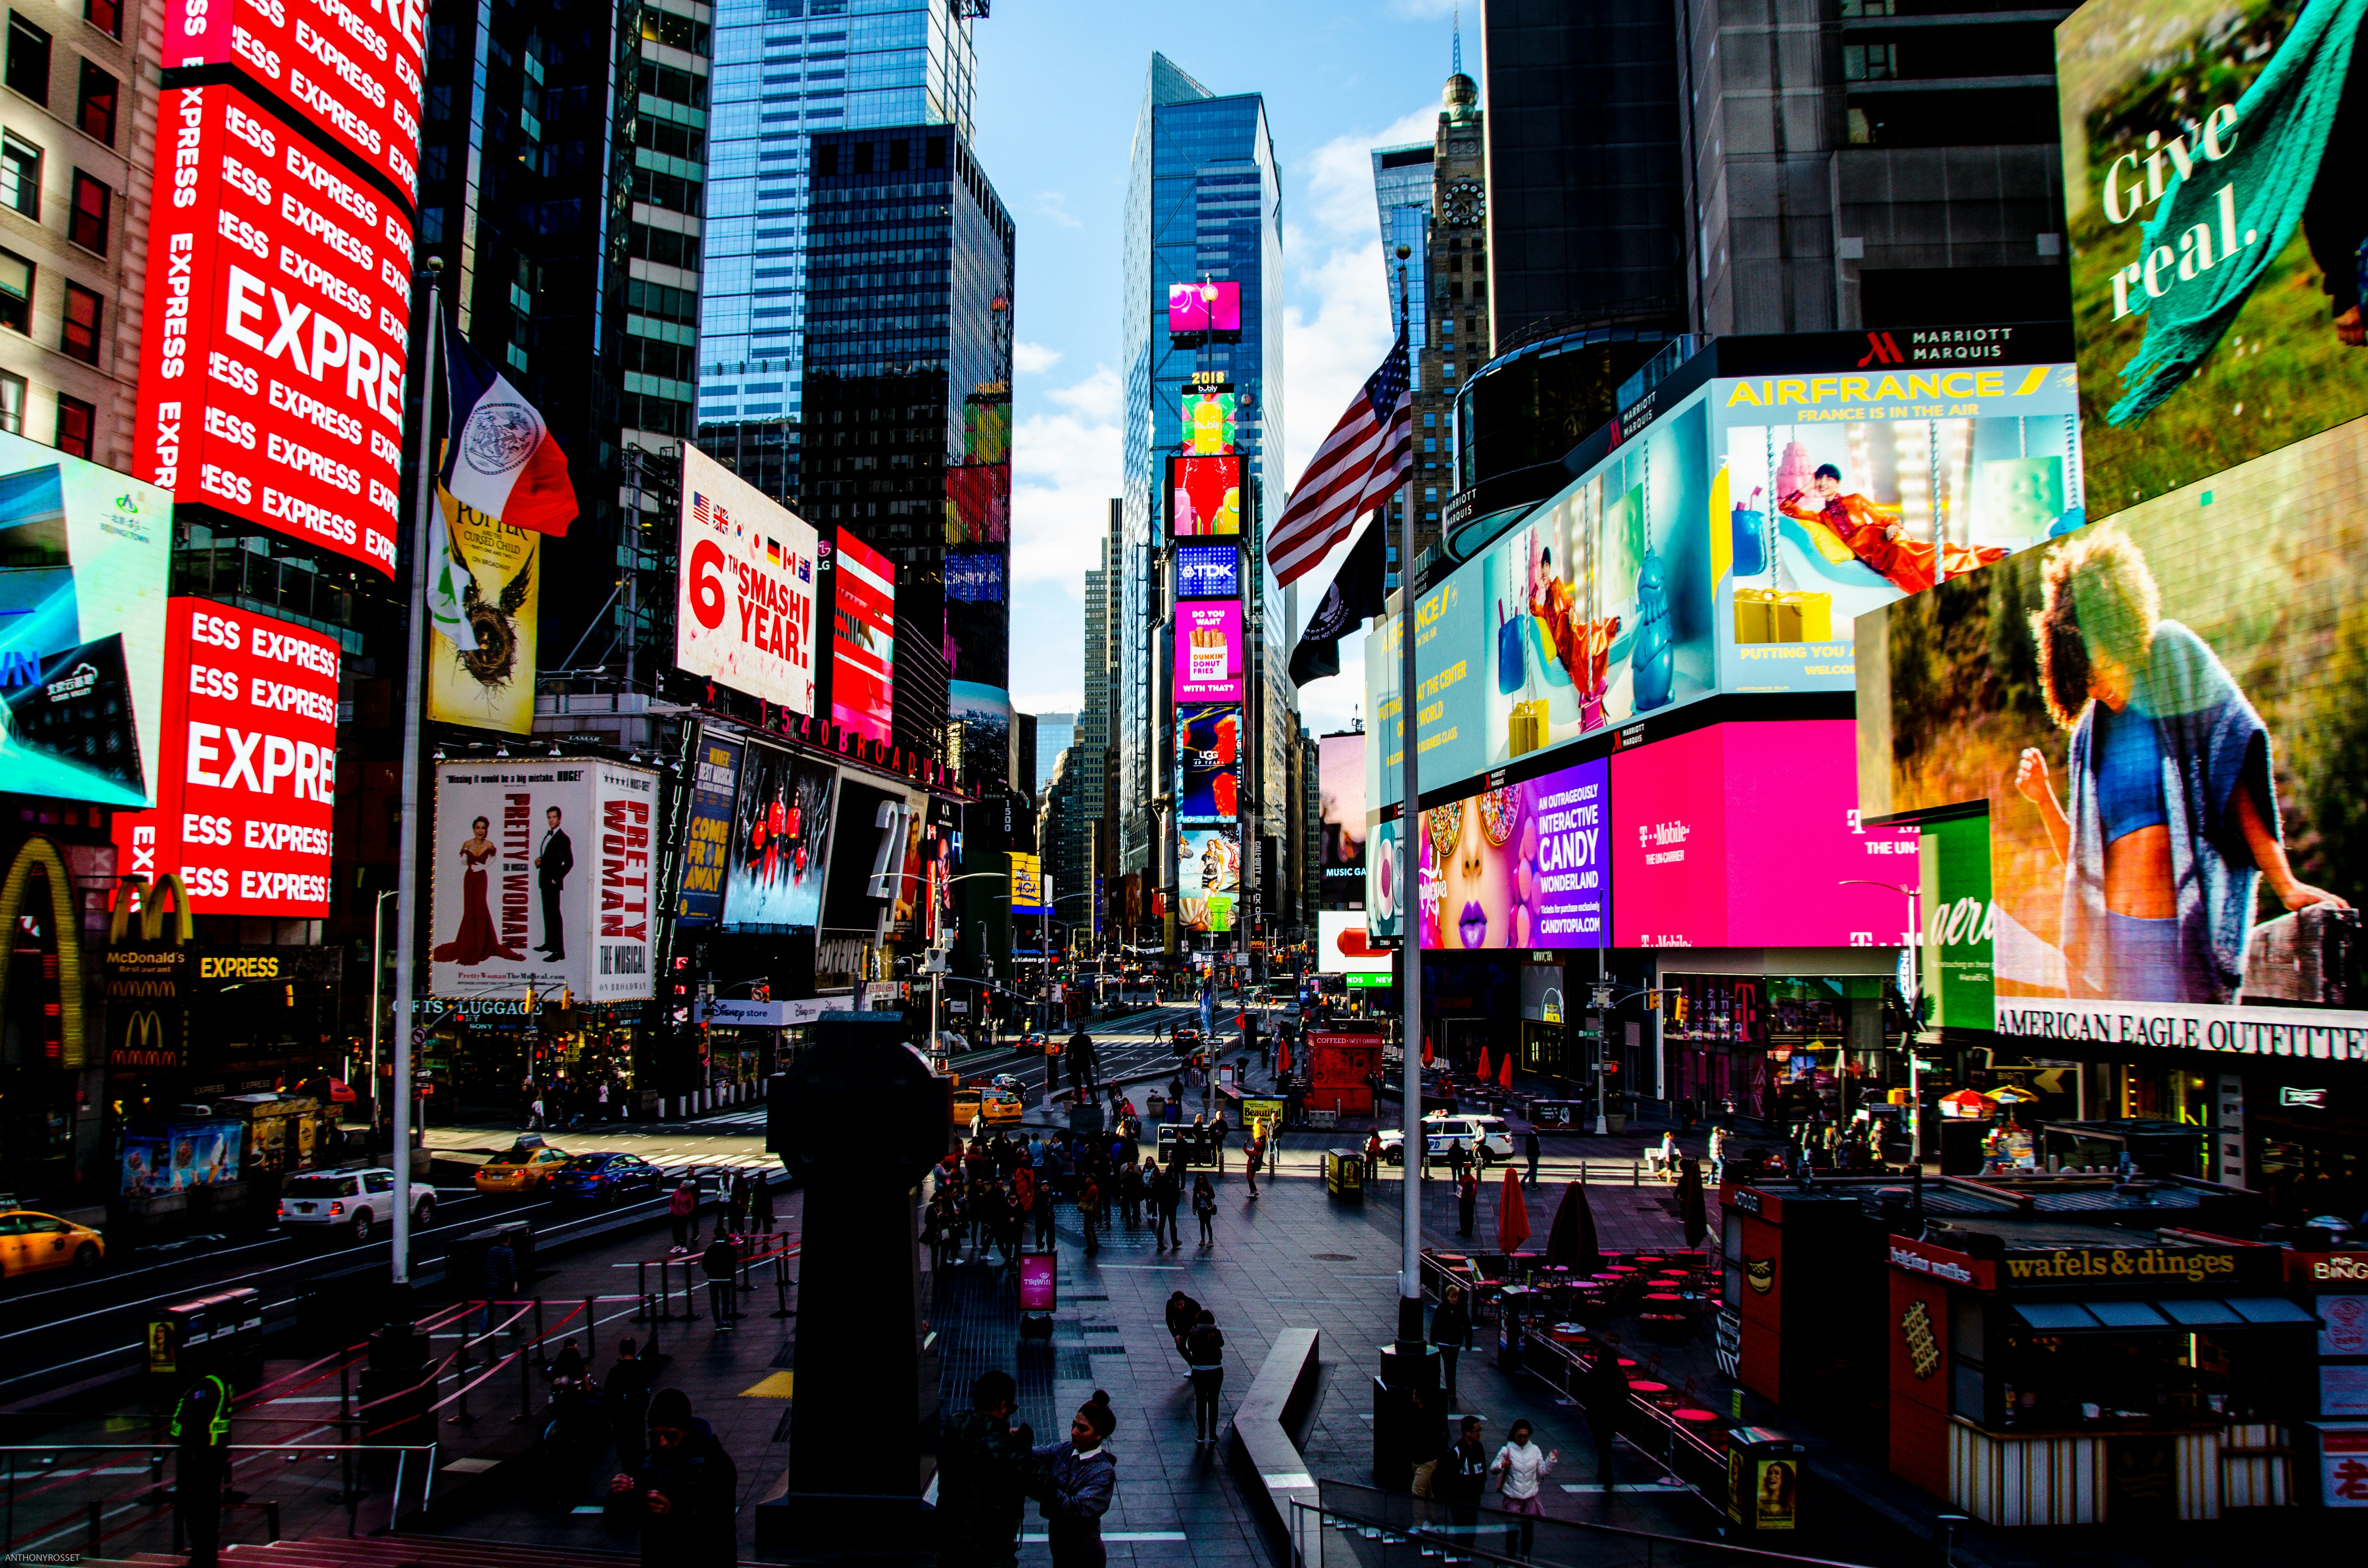
Case Study: Times Square's COVID-19 Transformation
Let's analyze how Times Square - one of the world's busiest tourist destinations - evolved during and after the pandemic using temporal queries:
"I need to understand how Times Square's business landscape changed during COVID-19. What closed, what survived, and what new businesses emerged?"
I'll analyze Times Square's evolution from March 2020 through today, tracking business changes and identifying patterns.
camino.query({
query: "restaurants in Times Square",
lat: 40.7580, lon: -73.9855,
radius: 500,
time: "2020-03.." // Changes since March 2020
})
📊 Pandemic Impact Analysis (March 2020 - January 2025):
❌ Business Closures
47 permanent closures identified
- 15 restaurants (32% of closures)
- 12 retail shops (26%)
- 8 entertainment venues (17%)
- 7 hotels/hostels (15%)
- 5 service businesses (10%)
Notable Losses: Planet Hollywood flagship, multiple Broadway-themed restaurants, several longtime souvenir shops, budget hotel chains catering to tourists.
✅ New Openings
31 new businesses opened
- 11 quick-service restaurants (35%)
- 8 experiential retail (26%)
- 6 outdoor dining venues (19%)
- 4 ghost kitchens (13%)
- 2 coworking spaces (7%)
Emerging Trends: Shift from sit-down dining to quick service, rise of outdoor dining infrastructure, pivot to delivery-focused operations, new hybrid work-tourism spaces.
🔄 Business Transformations
23 significant modifications detected
- 12 added outdoor seating (52%)
- 7 changed business models (30%)
- 4 rebranded completely (18%)
Adaptation Strategies:
- Theater restaurants → takeout/delivery focused
- Tourist shops → local convenience stores
- Hotels → extended stay/residential
📈 Comparative Analysis: Point-in-Time Snapshots
pre_covid = camino.query({
query: "restaurants",
lat: 40.7580, lon: -73.9855,
time: "2019-12-01" // December 2019 baseline
})
peak_lockdown = camino.query({
query: "restaurants",
time: "2020-06-01" // June 2020 peak lockdown
})
current = camino.query({
query: "restaurants" // Current state
})
📊 Restaurant Density Evolution
| Time Period | Total Count | Change | Key Characteristic |
|---|---|---|---|
| Dec 2019 | 127 | Baseline | Peak tourism, full capacity |
| Jun 2020 | 89 | -30% | Many temporarily closed |
| Jan 2025 | 108 | -15% | Recovery with new mix |
Key Insight: While total restaurant count recovered to 85% of pre-pandemic levels, the composition shifted dramatically - from 60% full-service to 70% quick-service establishments.
Powerful Temporal Query Patterns
🕐 Point-in-Time Queries
See any location as it existed at a specific moment:
Use Cases: Historical research, before/after comparisons, regulatory compliance checks
📈 Change Tracking Queries
Identify what's changed since a specific date:
Use Cases: Impact analysis, trend identification, market opportunity detection
🔄 Period Comparison Queries
Compare two specific time periods:
Use Cases: Development tracking, gentrification analysis, investment evaluation
Beyond COVID: Temporal Intelligence Applications
🏗️ Urban Development Analysis
Track how neighborhoods transform with new infrastructure:
- Monitor business changes after new subway stations open
- Analyze gentrification patterns over 5-10 year periods
- Evaluate impact of major developments on local businesses
- Track seasonal business patterns in tourist areas
📊 Market Research & Competitive Intelligence
Understand market dynamics and competitive landscapes:
- Track competitor expansion/contraction over time
- Identify emerging business clusters and trends
- Analyze market saturation and opportunity windows
- Monitor franchise growth patterns in new markets
🏛️ Policy Impact Assessment
Measure real-world effects of policy changes:
- Evaluate business impact of zoning changes
- Track outcomes of economic development initiatives
- Monitor effects of minimum wage increases on business density
- Assess tourism recovery programs effectiveness
Technical Implementation
Adding temporal intelligence to your location queries is simple with our new time parameter:
from camino_ai import CaminoAI
client = CaminoAI(api_key="your_api_key")
# Track COVID impact on restaurants
response = await client.context_async({
"location": {"lat": 40.7580, "lon": -73.9855},
"radius": 500,
"context": "pandemic business impact",
"time": "2020-03.." # Since March 2020
})
if response.temporal_analysis:
print(f"Summary: {response.temporal_analysis.summary}")
print(f"Added: {len(response.temporal_analysis.added)}")
print(f"Closed: {len(response.temporal_analysis.removed)}")
print(f"Area Impact: {response.temporal_analysis.area_impact}")
# Compare two specific periods
comparison = await client.query_async({
"query": "coffee shops",
"lat": 37.7749, "lon": -122.4194, # San Francisco
"time": "2015..2025" # 10-year evolution
})
The Intelligence Advantage
What makes temporal location intelligence transformative isn't just seeing change - it's understanding patterns of change:
🎯 Significant vs. Minor Changes
Our change classifier distinguishes between meaningful area evolution (new businesses, closures, type changes) and routine data updates (phone numbers, hours, metadata). This means you see only the changes that matter for decision-making.
Real Business Impact
Organizations using temporal location intelligence could see:
- Better site selection accuracy by analyzing historical success patterns
- Faster market trend identification through change detection
- Improvement in investment ROI by timing market entry
- Reduction in research time for historical area analysis
Start Your Temporal Analysis Journey
Whether you're tracking pandemic recovery, analyzing gentrification, evaluating policy impacts, or understanding market evolution, temporal location intelligence transforms static maps into dynamic insights about how our world changes.
The Times Square analysis above revealed not just that 47 businesses closed, but that the area fundamentally shifted from tourist-focused full-service dining to local-friendly quick service - a transformation that traditional location APIs would miss entirely.
Ready to add the dimension of time to your location intelligence? Start exploring with Camino AI or check our API documentation for temporal query patterns. See the full Times Square COVID analysis for more insights.